Mueller matrix ellipsometry
This is a tutorial example for Mueller matrix ellipsometry. We investigate a simple grating using
JCMsuite. A scattering simulation is performed, the reflected fields are
Fourier-transformed and a Scattering matrix postprocess computes (among other things) the
Mueller matrix entries.
The three dimensional geometry is created exploiting the translational and periodic symmetry of the investigated grating. As such, the mesh is created as a simple two dimensional unit cell that is semi analytically extended in the z direction, and periodically repeated in the x direction. In the y direction we simulate infinity by means of perfectly matched layers. The grating is continued infinitely in the plane direction, and periodically repeated along the x axis. More information about this type of setup can be found here.
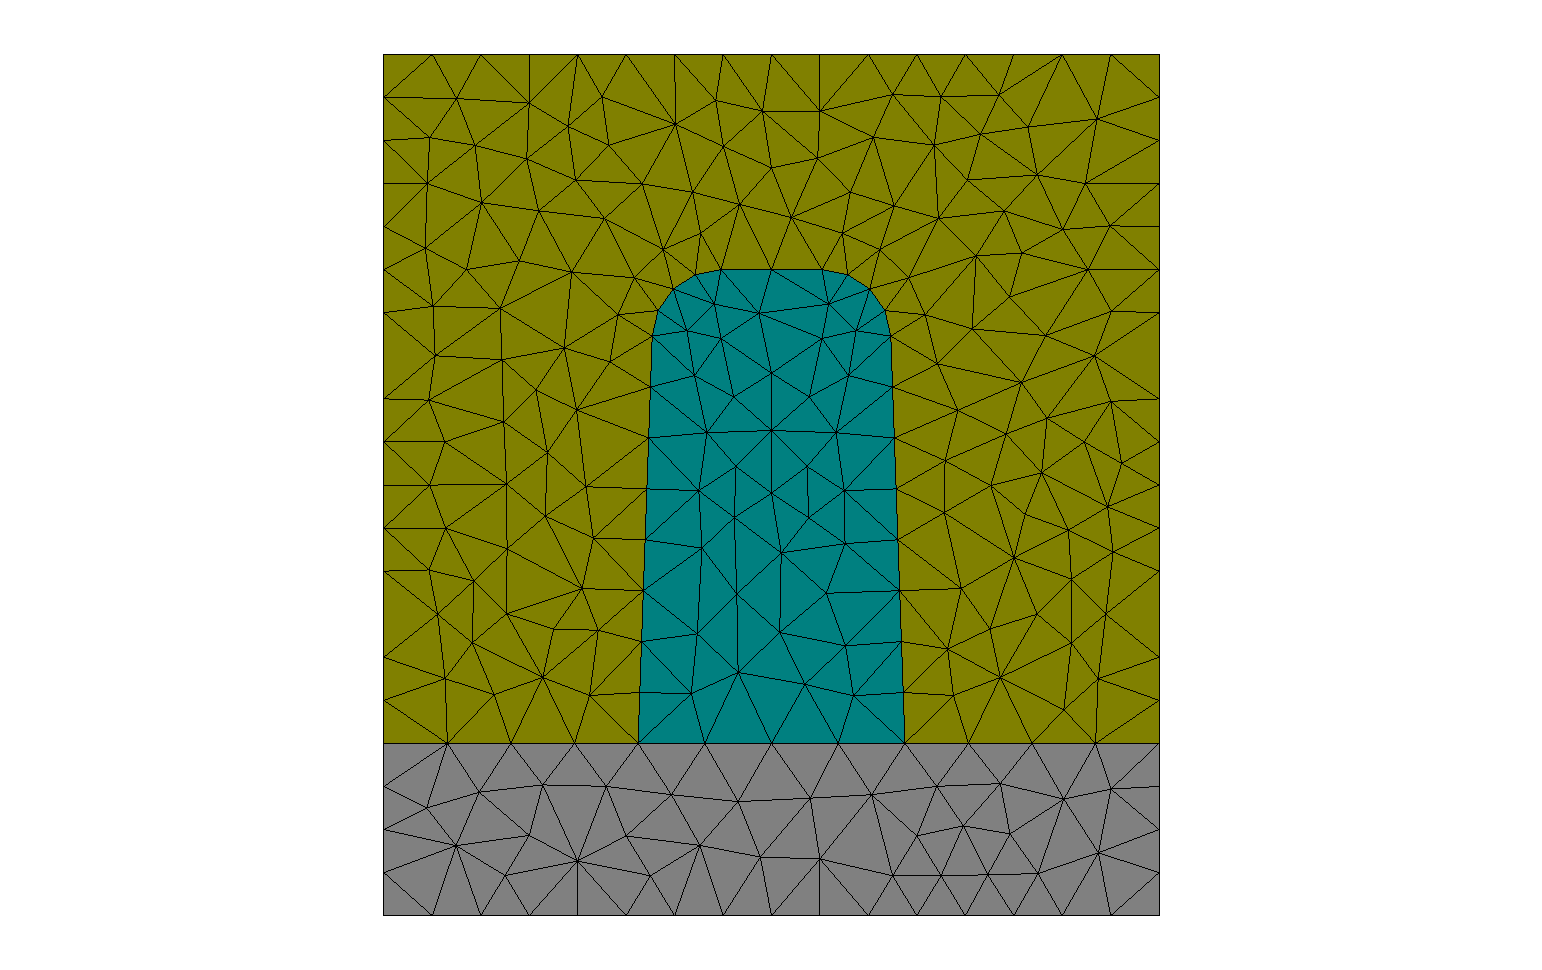
The geometry consists of a Glass substrate on which a Silicon grating is placed. The material data for Silicon in the investigated wavelength range is obtained from refractiveindex.info.

The discretized geometry.
Illumination
The grating is illuminated from above by linearly S- and P-polarized plane wave light source, from an incidence angle of 65 degrees and under a 45 degree sample rotation. The wavelength used for the creation of the field plots are at 365 nanometers.
1 2 3 4 5 6 7 8 9 10 11 12 13 14 15 16 17 18 19 20 21 22 23 24 25 26 | SourceBag { # S
Source {
ElectricFieldStrength {
PlaneWave {
3DTo2D = yes
Incidence = FromAbove
SP = [1 0]
Lambda0 = %(vacuum_wavelength)e
ThetaPhi = [%(theta)e, %(phi)e]
}
}
}
}
SourceBag { # P
Source {
ElectricFieldStrength {
PlaneWave {
3DTo2D = yes
Incidence = FromAbove
SP = [0 1]
Lambda0 = %(vacuum_wavelength)e
ThetaPhi = [%(theta)e, %(phi)e]
}
}
}
}
|
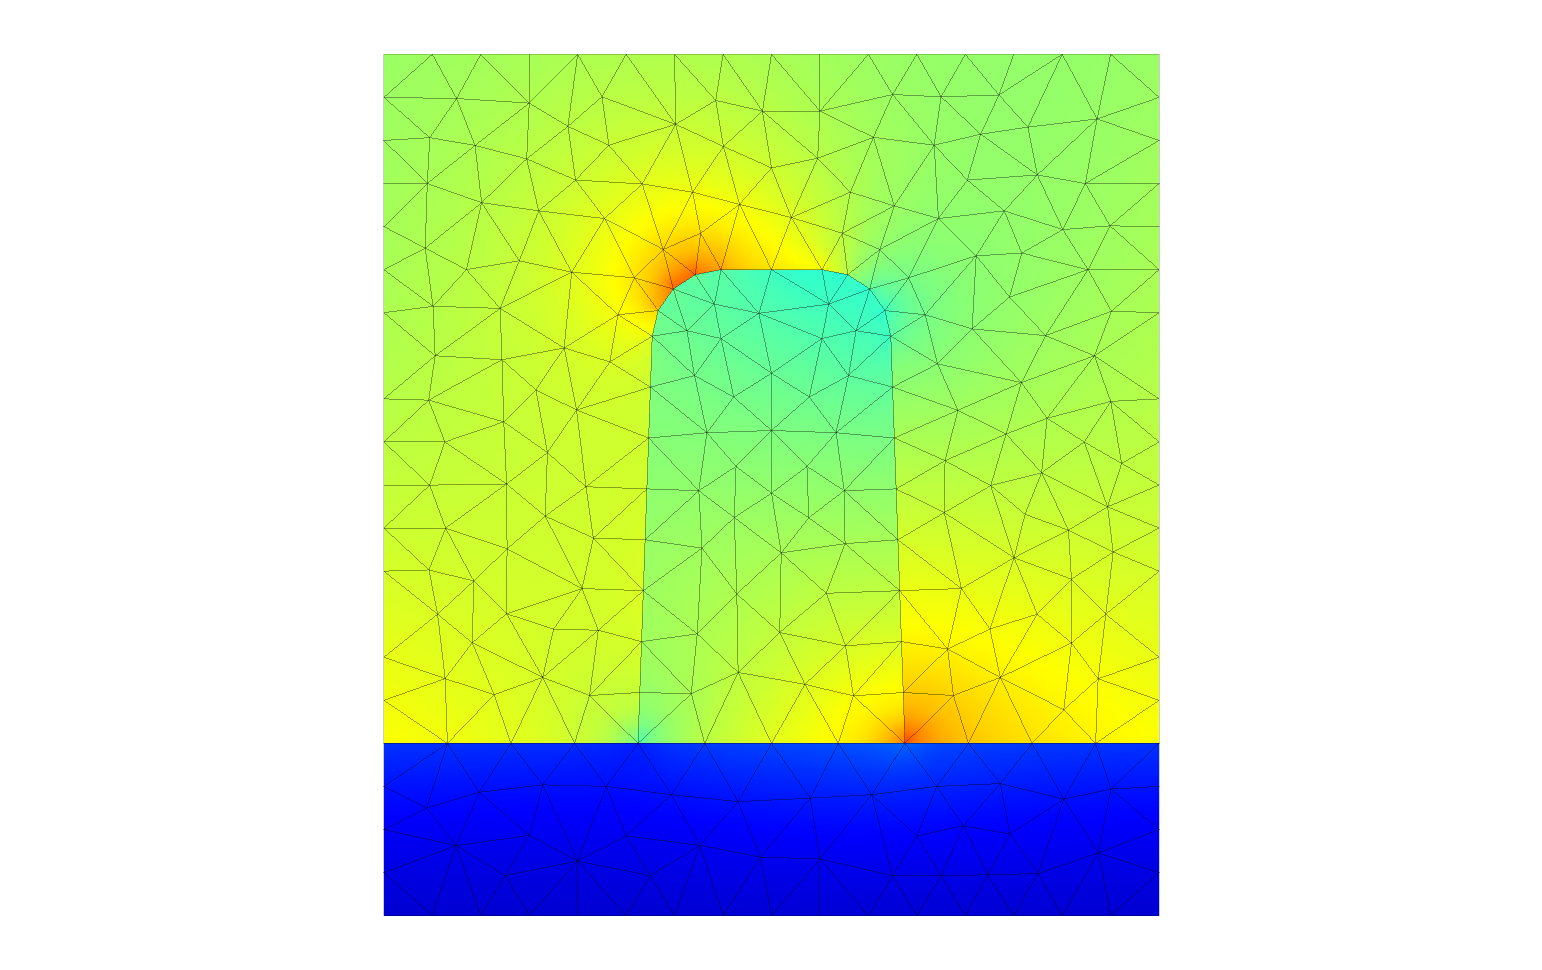
The electrical field intensities within the geometry are visualized below.

Light intensity using P polarized light as described above.
The FourierTransform postprocess is applied to the outgoing fields in a half space of the computational domain.
PostProcess {
  FourierTransform {
    FieldBagPath = "project_results/fieldbag.jcm"
    OutputFileName = "project_results/fc.jcm"
    NormalDirection = Y
    Rotation = X:Z:-Y
    Format = JCM
  }
}
By selecting NormalDirection = Y
within the project file this is defined as the upper half of the geometry. All upwards
scattered fields are taken into account through the periodic nature of the mesh. The
subsequent scattering matrix postprocess expects the z-axis to be the optical axis. As
such, we have to apply a final rotation to the output of the Fourier transform by setting
Rotation = X:Z:-Y within the project file.
The ScatteringMatrix postprocess takes the Fourier
transformed reflected fields of the scatterometry experiment and computes the Jones
matrix, the Mueller matrix, and the scattering matrix parameters  ,
,
 , and
, and  .
.
PostProcess {
  ScatteringMatrix {
    Format = JCM
    InputFileName = "project_results/fc.jcm"
    OutputFileName = "project_results/sm.jcm"
  }
}
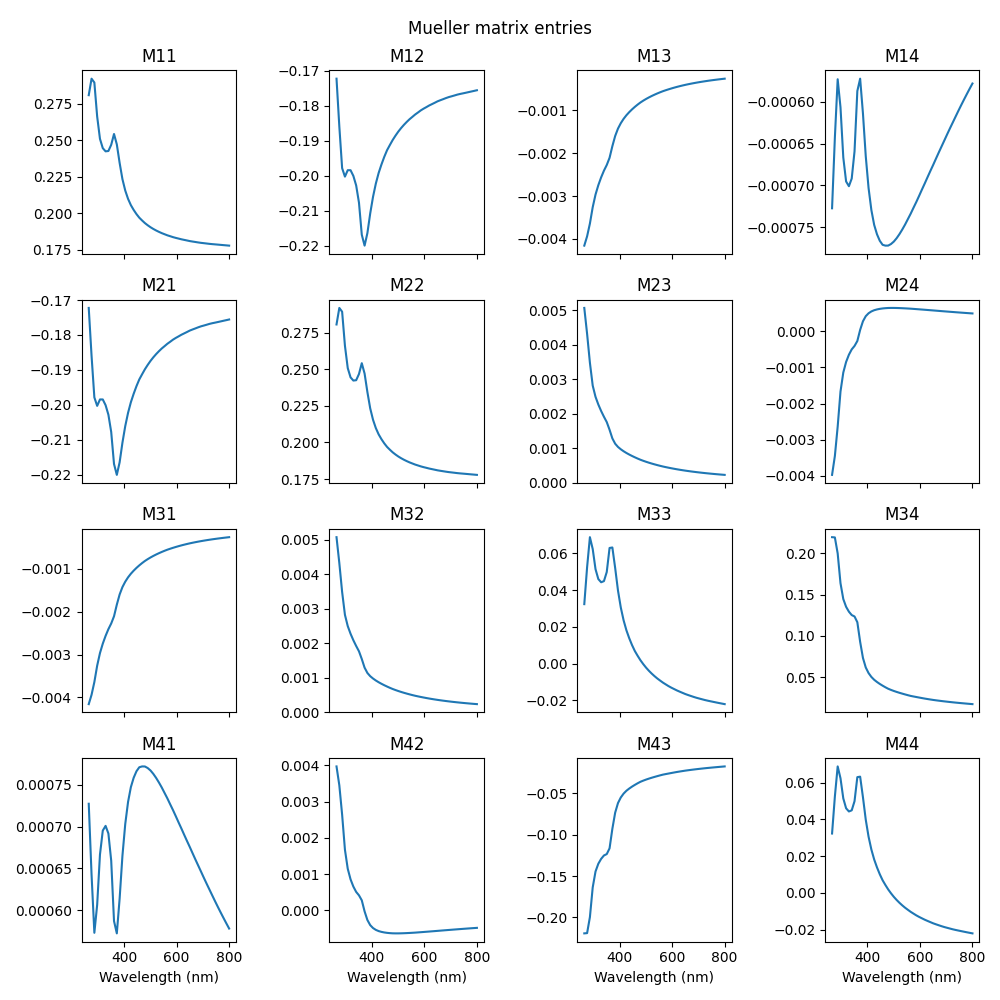
Below we show the results of a wavelength scan of the Mueller matrix entries in a wavelength range between 266 and 800 nanometers.

Mueller matrix plot showing the matrix entries plotted over the wavelength of the incident light.
Example code for performing these computations locally can be found here.